Sure, SEO isn’t nearly as technical as it was in the past.
We’re catching a serious break there – especially the smaller, less established websites who are getting a legitimate crack at their Goliath counterparts by creating better content.
(And you’ve gotta root for the Davids in the SEO world.)
But while the SEO “black box” may be starting to part its lid, that doesn’t mean we get free license to write whatever the hell we want and expect to swim in a sea of gold coins, a la Scrooge McDuck.
Everything we create still needs to be data-led…
From the things we are pretty familiar with, like keyword research and content topic coverage, to the new kid on the block: All the user signals RankBrain cares about.
Wait, how are we quantifying what RankBrain cares about?
Well, we’re not.
At least there is nothing out there YET in terms of tools that tell you what to do to make the RankBrain gods happy. So I created one. Go ahead and make a copy of it.
I figured it’s just a matter of quantifying the main user signals RankBrain cares about, like: expected CTR, dwell time, short clicks v. long clicks, and pogo-sticking.
(You don’t need to know what any of those things mean right now.)
And because the intent and expectations behind each keyword search is 100% unique, we can’t take a global approach to creating content.
But you need to know right now is that there are two things we need to focus on when creating content:
- Getting more clicks than Google expects you to get in your current ranking position.
- Keeping visitors on your site for a long time, and hopefully leaving them no reason to return to SERPs to find another answer from one of your competitors.
And we are going to do that in two ways: Optimizing the hell out of our title tags, and creating the best on-page experience expected for each specific target keyword.
We’re going to do both using data from an insanely simple audit and formula.
Using a template to optimize the hell out of our title tag (10 min)
Before you go any further, open the explainer video below (please subscribe 😊), and this tool. It will work best if you do-as-you-go.
Or don’t! You’re the boss of your time.
The first thing we’re going to do is figure out how to create the perfect title tag.
We are going to attempt to create the most clickable title on page 1 of search.
RankBrain aside note: What you see in SERPs at any given time is the direct result of simple math and human behavior, updated in real time. Old-school factors like inbound link profiles and on-page SEO only get you a seat at the table. The content that stays there is the content that has satisfied the searcher behavior signals that RB is looking for. In other words, what you see in SERPs is a reflection of what people like the most, therefore, we would be stupid to not use it as a guide.
In order for us to create the perfect title tag, there are 5 factors (there’s probably more, but this is what I landed on) we can audit in SERPs to determine what searchers are clicking on the most often:
- Are people looking for a list article?
- Are people looking for a published year in the title?
- Does the exact match keyword need to be in the title?
- Does recency of publish date matter?
- What is the intent of the keyword? Informational? Commercial?
And as a bonus, are there any phrases that are commonly used that we need to know about?
Step 1: Audit page 1 for your target keyword.
Google your keyword and add each of the title tags from page one to the spreadsheet into columns C/D.
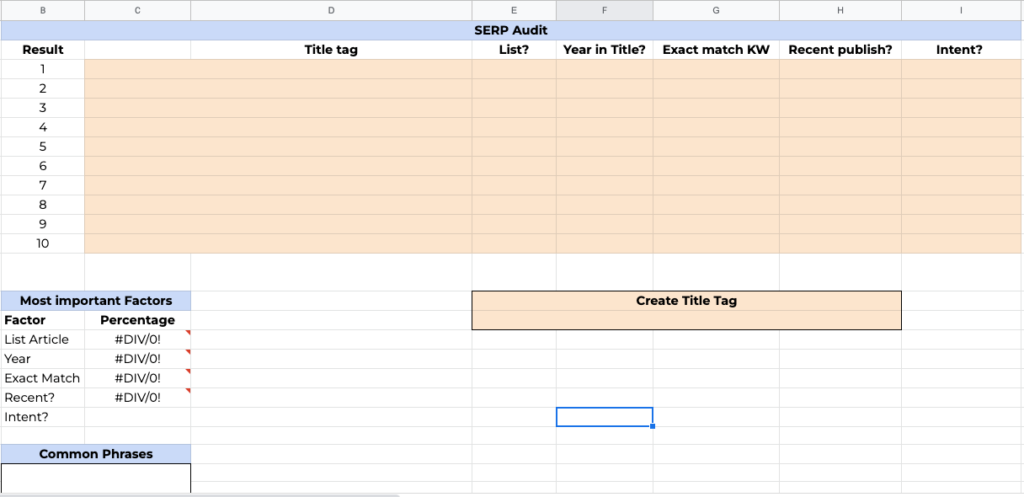
Then answer “Yes” or “No” to each of the columns E, F, and G based on what you see.
In column I you’ll have to make a judgment call on the intent of the page.
Hint: if it looks like a product page, it’s commercial. If it looks like a blog or pillar page, it’s informational.
As you progress through your audit, the “Most important factors” box at the bottom will auto-populate data, indicating the percentage of page 1 results that utilize each factor.
If our target keyword is “Best places to live in Mexico”, our completed audit will look like this:
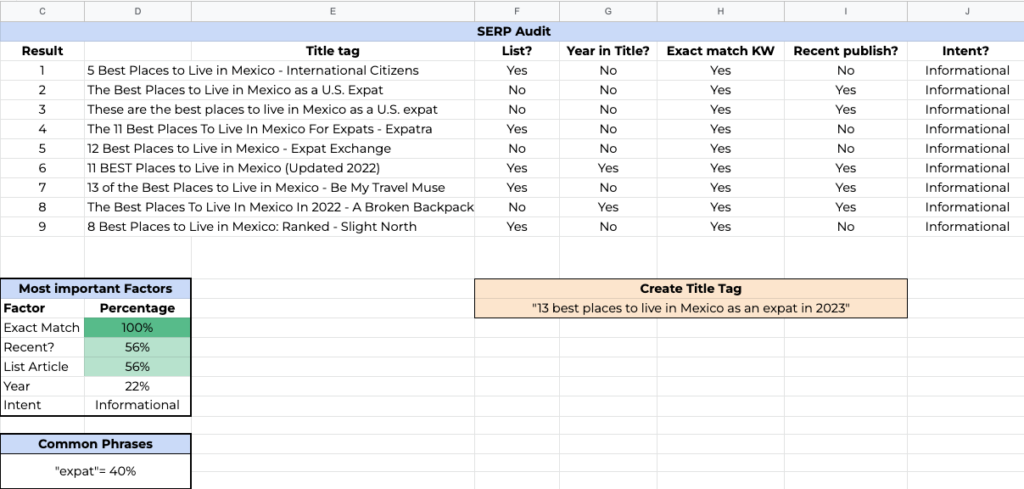
So what do we know about the titles people are clicking on?
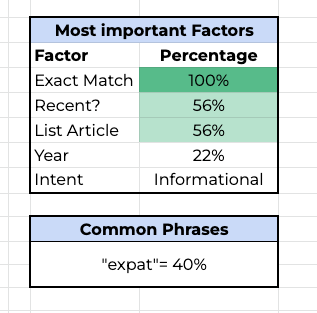
Well, quite a bit, actually. we know:
- 100% of titles use the exact match keyword. This is a MUST-HAVE for our title tag.
- 56% were published this year; recency seems to be important (good to know if we’re re-optimizing!).
- 56% of articles are lists; this also seems to be important.
- 22% include the year in the title, this seems to be a nice-to-have factor.
- 40% use the phrase “expat”, this must be important.
- The intent is informational.
Step 2: Write the optimized title tag
With that data, we have a pretty good idea of what searchers are most interested in clicking on.
To our best ability, and based on actual user signals, we’re going to create the optimized title tag that will maximize my number of clicks.
Here’s an option of what we could go with:
13 best places to live in Mexico as an expat in 2023
Note that we have made this a list article, we included the year, the exact match keyword, and “expat.”
Step 3: Make sure it looks good.
Hop into the Yoast plugin or To The Web’s title tag tester to make sure the title is the correct length (you don’t want it getting cut off).
And don’t forget to check mobile too! Let’s see how ours looks:

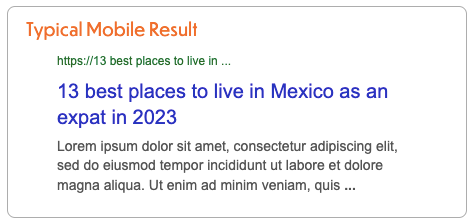
Good and good. Our title tag is done, and looks solid. We are ready to move onto the on-page experience.
Optimizing the hell out of our on-page experience (30 min)
So our main objective here is to keep people on the page as long as possible, and hopefully keep them from ever going back to search results (a negative signal).
(Oh, and many of the factors we audit in this section will be universal to your other similar pages, so you’ll get an idea of which changes you need to make globally.)
There are six primary factors I can think of that will impact this goal in a positive or negative way. The questions we need to ask are:
- Have we covered our topic cluster sufficiently using Clearscope or MarketMuse? We want to be more thorough than any of our competitors.
- Is the content readable, or are we using a tiny font that will annoy people?
- Is the page littered with too many ads and CTAs compared to our competitors?
- Should we be using video in our content? Some keywords have a 100% expectation of video, is that the case for our keyword?
- Should we have a broad usage of images in our content? Some keywords also have a strong expectation of visual content.
- Is our page speed fast enough relative to our competitors?
For this part of the audit, we’ll have to open up each of the URLs in page 1 of SERPs and manually check.
Good news note: Fortunately, you’ll likely only have to do this once for your readability, ads/CTAs, and page speed, because most of that stuff will be similar (if not identical) to your other blogs or landing pages, and you’ll see what needs to be fixed globally.
Step 1: Scan and fill out the spreadsheet
Quickly scan each page and fill out this tab of the spreadsheet (30 min, max).
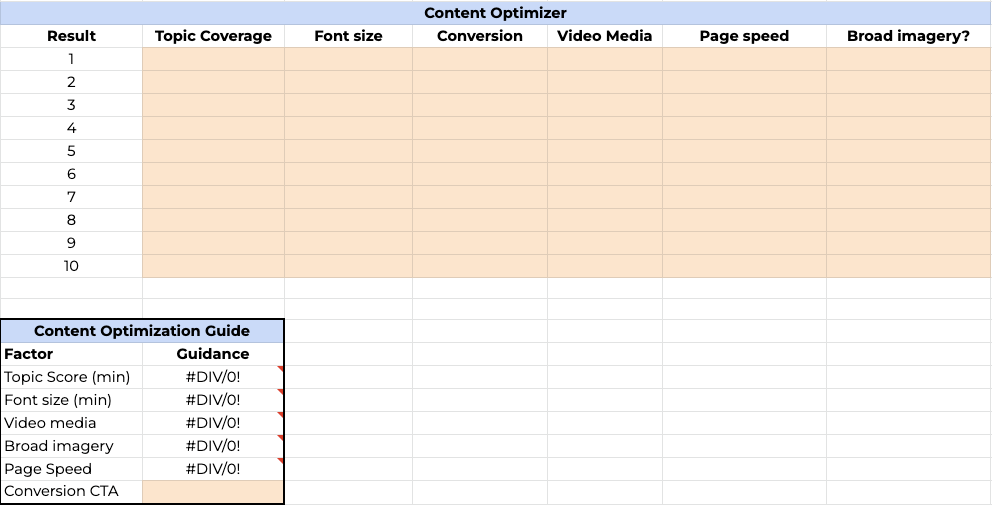
A few tips:
- Check out Clearscope or MarketMuse for your content scores.
- Use PageSpeed insights for your speed test.
- Use WhatFont for your font size.
- Use your best judgment for what qualifies as “broad imagery.”
As with the previous sheet, this will auto-populate each factor into the “content optimization guide” below.
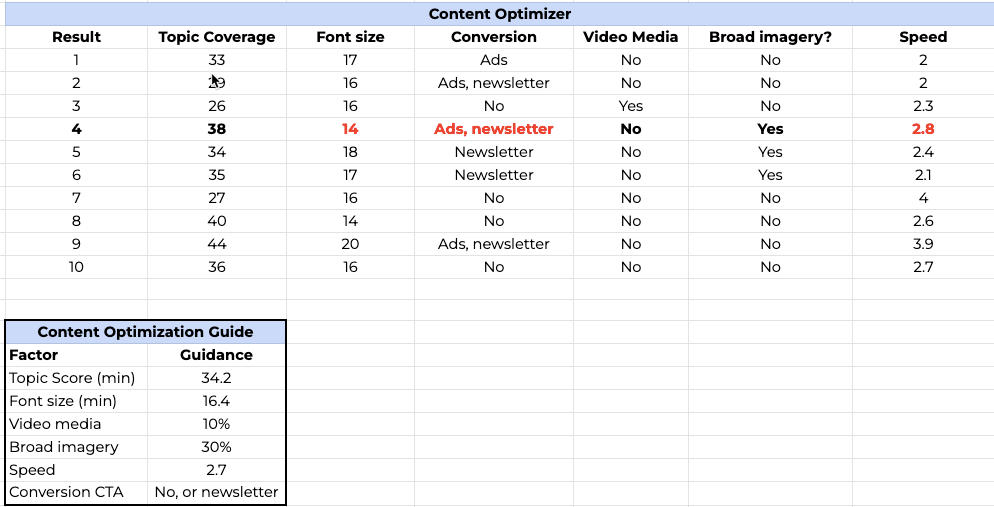
Step 2: Figure out what matters
As before, we now know quite a bit about what’s important (and not important) for the on-page experience.
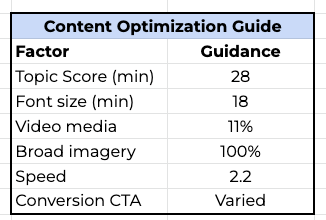
Here’s what we know:
- We need to hit a topic score of at least 28. I’ll shoot for better than 40 to be the best of the bunch.
- The font size is rather large, indicating that readability for quick scanning matters. We’ll use a font size of at least 18, but not so big that it looks like a coloring book.
- It seems like video doesn’t really matter, we won’t create one.
- Using lots of imagery is a must. We may not even be able to survive without it.
- Our page needs to load in a minimum of 2.2 seconds. The top 4 results averaged 1.6 seconds, while the bottom five 5 averaged 2.8 seconds.
- It seems like we can load up our page with any type of CTAs and be fine. As a matter of fact, some of these pages had an obnoxious amount of ads, and they still rank well.
Now we’re ready to create or adjust the elements of our page, based on what the data told us will work best.
*Important note! If you used to have a piece of content that was ranking on page 1, but got booted into the exiles of page 2+, this would be a damned good technique to evaluate why that happened, and fix it. It can also help you figure out why your mobile rankings aren’t up to snuff, too!
Conclusion
There was nothing particularly difficult about what we did. As a matter of fact, it really just came down to due diligence and the simplest of formulas.
But we really shouldn’t understate the importance of that hard work, because 95% of SEO is observing what is literally right in front of our faces, and making smart decisions based on what we see.
Every keyword is unique, as are searcher expectations for that keyword. So we can’t take the same approach to every piece of content.

